Room Prices Analysis (Part 2): Data Cleaning and Geolocation with Python and Shapely
In this post we’ll see how to clean data, and how to deal with geographical information in Python. This post is part of a data science project of the room rental prices in Vancouver.
- Read the Vancouver Room Prices article
- Go to Part 1 (How to scrape websites with Scrapy)
- Go to Part 3: Natural Language Modeling and Feature Selection in Python
Data Overview
By scraping a room ads website, we collected information about the room listings in Vancouver, a set of records was extracted from each post:
- title The title of the posting
- content The HTML code for the main content
- price
- latitude
- longitude
- parsed_on Time when the post was parsed by the scraper
- updated_on Time when the post was lastly updated by the user
- attributes A list of extra attributes, like dogs or cats allowed, number of bedrooms etc.
However, data collected from the web (really, from any source) is rarely free of errors, therefore we need to get rid of basic inconsistencies before starting the statistical analysis.
Additionally, we would like to produce new features that will aid the modeling stage. This is very important because with great, predictive features, we have potential to produce a sensible model.
Normalizing Strings with Pandas
Raw content from websites is usually messy, just look at the typical post title:
★★★BEST ROOM★★★ master bedroom <b>available may 1st $900/mo </b>In its raw form, the title contains redundant and/or useless information:
- ★★★special characters★★★
<b>HTML tags- CAPITAL letters
To get rid of all these issues it is sufficient to do some filtering with regular expressions. If you don’t know what regular expressions are, you really need to learn about this in the Python regex tutorial.
To apply the operations on our strings, we’ll make use of the excellent Pandas library. Pandas is surprisingly efficient for this kind of processing, as it implements vectorized operations that are concise, performant and easy to use.
The idea is very simple, whenever you have a pandas.Series object containing strings, you can access a variety of string-vectorized operation through the attribute str. In the following code we apply the lower, strip and replace operations in sequence.
# Lowercase
title_clean = title.str.lower().str.strip()
# Remove special symbols
title_clean = title_clean.str.replace('[^a-zA-Z0-9$]', ' ')
Finally, to remove all the html tags from the content we’ll use the fast lxml library and the method apply:
import lxml.html
def cleanse_html(html):
    return lxml.html.document_fromstring(html).text_content()

content_clean = content.apply(cleanse_html)
content_clean = content_clean.str.lower().str.strip().str.replace('[^a-zA-Z0-9$]', ' ')
Dealing with Geographical Data in Python
The Google Maps links scraped from the posts usually contain the exact latitude and longitude of the geographic location. While it is possible to use directly those variables in a model, it is much better to transform them in real-world locations, as this simplifies modeling and interpretation.
Obtaining Geographical Data
Geographical data is made available through public websites. I was able to obtain geographic files for Vancouver from the OpenData catalog, which provides a huge variety publicly accessible data sets (a lot of them). To obtain boundaries for the Vancouver neighbourhoods I used the local area boundary data set in KML format.
OpenStreetMap, is another highly recommended source of geographical data, especially when you need coast lines, streets and maps in general.
Loading Map Data in Python with Shapely
First of all, let’s talk on which data we’re dealing with. What we have is geographic boundaries, that means a set of polygons that delimit a geographical area, this data is usually referred as vector data.
Polygons however are not the only kind of vector data that can go in a map. Other kinds of geometrical primitives are points, lines and their combinations. Data formats manage this information in different ways, but the building blocks are generally the same.
My favorite data format is GeoJSON because it’s intuitive and web-friendly. An example is as follows (taken from the official spec). There is a toplevel object of type FeatureCollection, made of a list of geometric features, for example Point, LineString and Polygon. Along with those it is possible to store extra properties:
{ "type": "FeatureCollection",
    "features": [
      { "type": "Feature",
        "geometry": {"type": "Point", "coordinates": [102.0, 0.5]},
        "properties": {"prop0": "value0"}
        },
      { "type": "Feature",
        "geometry": {
          "type": "LineString",
          "coordinates": [
            [102.0, 0.0], [103.0, 1.0], [104.0, 0.0], [105.0, 1.0]
            ]
          },
        "properties": {
          "prop0": "value0",
          "prop1": 0.0
          }
        },
      { "type": "Feature",
         "geometry": {
           "type": "Polygon",
           "coordinates": [
             [ [100.0, 0.0], [101.0, 0.0], [101.0, 1.0],
               [100.0, 1.0], [100.0, 0.0] ]
             ]
         },
         "properties": {
           "prop0": "value0",
           "prop1": {"this": "that"}
           }
         }
       ]
     }
We downloaded the neighbourhoods in KML format (which is sort-of an XML), how do we transform to GeoJSON? We can use the software qgis (available in the Ubuntu repositories). Converting beetween file formats is quite easy using the tool ogr2ogr:
ogr2ogr -f "GeoJSON" local.json local.kmlTo read GeoJSON in Python we’ll use the library Shapely, to deal with geometrical objects in general (but especially geographical data).
Loading stuff in Shapely is pretty easy, each geometry attribute (see the above example) can be transformed in a shape object very easily. In the following example we load the GeoJSON file in Python and then create shapes from the geometry attributes. Finally, we create a MultiPolygon object from the extracted shapes, which is a container for multiple polygons.
import json
from shapely.geometry import shape

data = json.loads(open("local.json").read())

shapes = []

for i, _ in enumerate(data['features']):
    sh = data['features'][i]['geometry']
    s = shape(sh)
    shapes.append(s)

shapes = MultiPolygon(shapes)
You can use the following comand to easily plot the neighbourhood geometries with matplotlib. For example, you can use the functions fill_polygon and fill_multipolygon to plot Polygon and MultiPolygon objects:
import numpy as np
import pylab

def fill_polygon(g, o):
    a = np.asarray(g.exterior)
    pylab.fill(a[:,0], a[:,1], o, alpha=0.5)

def fill_multipolygon(g, o):
    for g in g.geoms:
        fill_polygon(g, o)

# Usage
fill_multipolygon(shapes, 'b')
fill_polygon(shapes[0], 'r')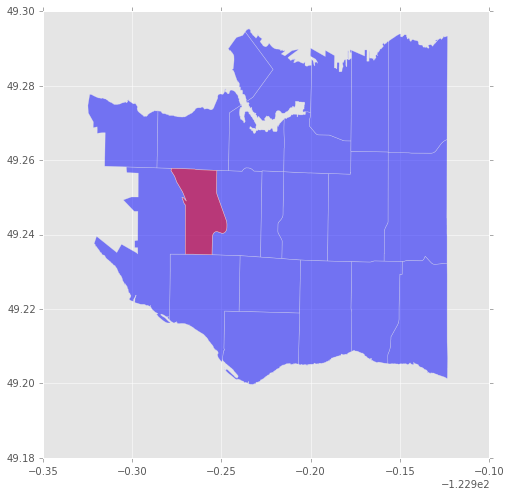
For more interesting plots I recommend the library folium that is able to overlay polygons on top of a real geographic map. Another option is basemap or if you’re feeling javascripty you can use d3.js.
Geolocating a neighbourhood from coordinates
The geographical data is basically a set of polygons corresponding to the Vancouver neighbourhoods. To assign each post to a neighbourhood we have to test if its latitude-longitude point is into the corresponding polygon. Geometry operations are Shapely territory.
For each Polygon in the variable shapes, we check if any of the points is contained using the method contains, and we associate the corresponding neighbourhood name.
points = posts[['longitude', 'latitude']]
neigh = pd.Series(name="neighbourhood", index=posts.index)

for i, _ in enumerate(shapes):
    name = data['features'][i]['properties']['Name']
    matches = points.apply(lambda pt: shapes[i].contains(Point(pt[0], pt[1])), 1)
    matches = matches.index[matches.nonzero()]
    neigh.ix[matches] = name

posts['neigh'] = neigh
The result is an association of each post with its neighbourhood. Unfortunately many posts don’t include a map, for these we can put a NaN value or the string Unknown.
| title | neigh | |
|---|---|---|
| 38822 | near downtown furnished room | South Cambie |
| 38823 | private master bedroom in amazing building | Downtown |
| 38827 | nice bedroom for rent may west end girl ... | NaN |
| 38828 | room for rent | NaN |
| 38830 | looking for roommate from may 1st to july 31st | Mount Pleasant |
Next steps
In this post we described the process of cleaning data and extracting features, in the next post we’ll proceed with the modeling phase, where we relate the prices with the post features.
Part 3: Natural Language Modeling and Feature Selection in Python